
What is the Racial Wealth Gap?
On this page, we provide answers to some frequently asked questions about racial wealth equity in Greater Boston. Where possible, we pair answers with links to resources that go deeper. If you have other questions, please submit those on our contact page, and it’s possible that we’ll post additional questions and answers to this page in the future.
1.
The Institute of Economic and Racial Equity at Brandeis University has a useful metaphor about the relationship between income and wealth: Income is like a stream. It flows by. You can collect what you need from it at any one moment, but, if it runs dry, you’ll be left thirsty. Wealth, on the other hand, is like diverting that stream into a reservoir. If the stream runs dry, you’ll still have plenty to drink. If your water needs increase, you have that back-up resource without needing to worry about conditions in the moment.
But access to wealth means so much more than just security against hard times. Wealth determines where you live, the quality of schools your children attend, whether banks will offer you a loan to buy a house or open a business, whether you’ll have comfortable care as you age, and how much you can give to the next generation.
Examining both wealth and income, therefore, provides a more complete picture of economic inequality, financial stability, and the opportunities available to a given family. It is particularly important when examining racial and ethnic disparities, as these often appear even more starkly in measures of wealth than in measures of income. In fact, while income gaps remain roughly level, racial wealth divides are large and growing. The median White household, for instance, earns about 1.7 times more than the median Black household but has about six and a half times the wealth, as shown in these two graphs.
A few other notes on the importance of wealth:
- Wealth is what gets passed down from generation to generation, influencing future opportunities and economic mobility over the long-term.
- Wealth can provide access to high-quality education, safe and stable housing, business opportunities, and other aspects of socioeconomic status that income alone may not guarantee.
- Wealth often translates into power and influence in society. It can affect everything from the ability to fund political campaigns to the capacity to shape public policy or the direction of corporate behavior.
2.
Substantial wealth disparities exist across racial and ethnic groups in many countries, and the United States is no exception. A substantial body of research has documented these disparities, often linked to systemic discrimination and historic injustices. The below graph offers perhaps the most common visual for the racial wealth gap, using data from the Survey of Consumer Finances (SCF).
By 2019, White wealth was almost nine times as high as Black wealth, and five times as high as Latino wealth. Because the SCF unfortunately does not have sufficient sample sizes for Asian Americans and Native Americans, these analyses of SCF data by race focus only on wealth levels for Black, White, and Latino households.
Other research finds that Asian-American households display considerable variability, driven by factors like immigration history, education, and intra-group diversity. In aggregate, the Urban Institute’s Financial Health and Wealth Dashboard estimates that median household wealth for Asian American and Pacific Islanders in Massachusetts is far above Black and Latino wealth, but still well below White wealth statewide. Other research, like A New Look at Racial Disparities Using a More Comprehensive Wealth Measure finds that when looking just at families with heads of household between 30 and 62, and after adjusting for differences in the age distribution, Asian Americans are the highest-wealth racial group in the U.S., with average market wealth of $1.2 million compared with $927,000 for white families.
Because Native American totals are even smaller than Asian American, data for them are even less-frequently included in these studies, but they also typically have far less wealth than White and Asian households.
Wealth disparities are often perpetuated by systemic issues, including discrimination in employment, housing, and education, as well as differences in intergenerational wealth transfers. However, these are general trends, and there is significant variation within and across racial groups. For instance, the wealth of immigrant households can often differ significantly from that of households with a longer family history in the United States.
3.
Wealth has never been distributed equally. Thomas Piketty explores the many dimensions of wealth (or property, as he calls it) inequality in A Brief History of Equality and shows that most nations have made some progress in advancing economic equality over the past 100 – 200 years. Some unwinding of inequality came through unfortunate circumstances, like war and national disaster, but much of it came through effective social and political movements, dismantling colonialism, passing progressive tax reform, and building social welfare states.
In the United States, economic inequality is inextricably connected to racial inequality, and after periods of partial progress, wealth disparities have once again grown over recent decades. While racial wealth gaps have grown significantly, wealth gaps have also widened by income percentile, educational attainment, and age. Trends in the Distribution of Family Wealth, 1989-2019 from the Congressional Budget Office provides a useful walk-through of the most recent trends, including detailed breakdowns across many of these dimensions.
Relevant resources:
4.
Researchers measure wealth as the total amount of assets you and your household own (e.g., retirement accounts, homes, cars, stocks and bonds) minus the total amount you owe (e.g., student loans, credit card debt, outstanding balances on mortgages). What’s more, assets are fluid. They grow and shrink based on any number of factors over time. Due to this complexity, estimating household wealth requires far more effort than simple survey questions on things like income.
The most detailed national data on wealth come from the Survey of Consumer Finances (SCF), which is administered every three years by the Federal Reserve Board. The SCF is a large undertaking that can take more than 1.5 hours to administer per respondent, and it often involves follow-up inquiries to correct for internal inconsistencies. But there are real limitations. For instance, while researchers can disaggregate wealth for White, Black, and Latino households, it does not have a large enough sample to report reliable estimates for smaller racial groups like Asian Americans, Native Americans, or Pacific Islanders, who often get lumped into an “Other” category. Additionally, sample sizes are only large enough to report estimates at the national level, meaning that we cannot produce estimates for Boston or even the state of Massachusetts.
The Survey on Income and Program Participation (SIPP) is another national survey that includes information on wealth. The SIPP is designed to understand how lower-income households interact with federal welfare programs, so its data on wealth is less detailed than the SCF. Sample sizes for the SIPP are sometimes large enough for reporting at the state level, but only for the most populous states. In Massachusetts, we can generate state-level wealth estimates, but without disaggregation for any racial groups other than White.
The Panel Study of Income Dynamics (PSID) is a third national survey on wealth that can be quite useful in some circumstances, but like the SIPP and SCF, the PSID is not able to generate useful local wealth estimates. The PSID is unique in that it’s a longitudinal study following specific families over time, tracking their changes in wealth, income and other use of financial resources. It also provides insights into how wealth changes across generations. Like the SIPP, however, the PSID’s data on wealth is less detailed than the SCF, limiting insight on how households at the very top of the income distribution accrue their wealth.
5.
With the best national surveys on wealth limited in their use at the local level, a couple of novel research efforts have emerged that attempt to fill that void.
Likely the best known in our region is data provided by the 2015 report, The Color of Wealth in Boston. Due to the high cost associated with administering a survey on wealth, researchers surveyed a relatively small sample of families regionwide to estimate net wealth by race. It generated estimates of a Black/White racial wealth gap far wider than national estimates from the Survey of Consumer Finances, suggesting that U.S.-born Black households in Greater Boston had a net wealth of just $8, as compared to $248,000 for White households. We know this is a rough estimate due to the small sample size. But if the estimate were $8,000 of wealth for Black families, or even $80,000, this would still represent a significant racial disparity (versus a point estimate of $248,000 for White households) that merits the same level of urgency for remedy.
Relatedly, a new effort is under way at the Federal Reserve Bank of Boston, with support from local philanthropy and business groups, to build on the survey in The Color of Wealth in Boston report. It will have a much larger sample size, which will enable some geographic breakdowns across Massachusetts and allow for greater nuance in exploring a greater number of racial and ethnic categories. Researchers hope to have new data from this survey sometime late in 2024 or 2025.
More recently, in October of 2022, the Urban Institute released its Financial Health and Wealth Dashboard, which includes a range of local data on financial wealth, including novel wealth estimates. They provide median wealth estimates for all residents at the Public Use Microdata Area (PUMA) level, which are Census-defined geographies of about 100,000 residents. But for states and some larger cities, including Boston, they present median wealth estimates that are broken down by race. They generate these novel wealth estimates by matching SIPP demographic characteristics—such as age, educational attainment, and race/ethnicity—to demographic characteristics in the American Community Survey. This allows Urban to use the SIPP’s wealth estimates at the state and local levels available in the ACS. Nevertheless, this means that while useful in broad strokes, these novel estimates rely on a range of assumptions that cannot perfectly reflect actual wealth disparities.
Relevant resources:
6.
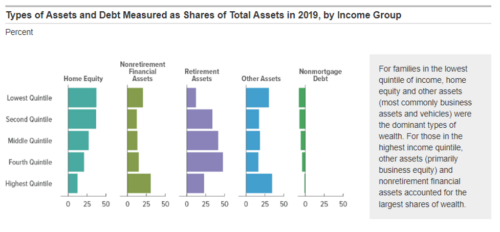
Net wealth is the total of all assets you own minus your debts. So, while many different things can count towards household wealth, the Congressional Budget Office clusters components of wealth into the following categories:
- Home Equity, which is the value of a family’s primary home minus the amount owed on one’s mortgage.
- Non-retirement Financial Assets, which capture things like savings accounts and regular investments in the stock market.
- Retirement Assets, which include the value of retirement savings accounts, like 401k’s and also the estimated value of Defined Benefit pensions, which have traditionally been more common for unionized workers. Estimates do not include Social Security benefits, which would increase this category’s share even further. Poor retirement security has been a particular challenge for low-wage workers in the U.S., as we have a retirement system that depends in large part on employer contributions.
- Other Assets, which captures many things like valuable art and cars. A large share of this is business equity however, which is why this increases for the highest quintile.
- Non-mortgage Debt, which includes a range of things like credit card debt, vehicle loans and student loans.
According to this CBO analysis, homeownership is the largest share of assets for the bottom 40 percent of the income distribution, and that the relative importance of homeownership declines as income goes up. Retirement assets make up the largest share of assets for the middle of the distribution.
Relevant resources:
7.
Workers tend to earn less when they are younger, and they’re more likely to take on debt to pay for things like a car or college for their kids. So, in general, people are better able to save and accumulate assets as they age.
Because of these life cycle differences, wealth estimates can sometimes be misleading, especially for younger populations. Take a 25-year-old college graduate with $40,000 in student loan debt. This young adult would show up as negative wealth, but may in reality have strong earning potential and end up retiring with significant wealth. For this reason, it can be helpful to try and control for different age distributions when looking at wealth of different racial groups.
Relevant resources:
8.
Scan our resource library for accessible research summaries of the best work that currently exists. These summaries provide topline findings paired with links to the primary research if you’d like to go deeper. Please also return to this site for new research briefs as we release them, and consider signing up for our email list.
Other research initiatives with curated research relating to racial wealth equity include:
- The Black Wealth Data Center collects data on national wealth gaps and provides access to a variety of wealth focused research. https://blackwealthdata.org/
- Shelterforce’s Racial Wealth Gap — Moving to System Solutions series explores the wealth gap across multiple dimensions, through articles, webinars and more. https://shelterforce.org/category/racial-wealth-gap/
- The Aspen Institute’s Financial Security Program aims to reduce financial inequality and promote greater shared prosperity, and makes this case through reports, conferences and by activating leaders in this space. https://www.aspeninstitute.org/programs/financial-security-program
- The Federal Reserve Bank of Minneapolis’ Racism and the Economy: Focus on the Wealth Divide features many reports examining the wealth divide. https://www.minneapolisfed.org/policy/racism-and-the-economy/focus-on-the-wealth-divide-additional-resources